You can get a Gantt chart free in three ways: a no-signup browser maker, a free open-source app such as GanttProject, or a stacked-bar chart built in Excel or Google Sheets. Check the limits before you commit, because many free plans lock the Gantt view, cap how often you can use it, or block exports.
Many "free" Gantt tools turn out to be trials, capped plans or locked exports. This guide compares what each free path includes as of November 13, 2026, then gives you a column-and-formula layout to copy, with the extras freelancers need, such as client approval dates and shared capacity across clients. It closes with the cases where a Gantt chart is the wrong tool. If your priorities shift every day, a status board may fit better, and our guide to defining Kanban covers that approach.
What does a Gantt chart show?
A Gantt chart is a bar chart that lays tasks out along a calendar, so you can see when each task starts, how long it runs and what it waits on. Four parts do most of the work: the task bars, the dependencies between them, milestones, and the critical path.
Henry Gantt popularized the format around 1910 to 1915, and Karol Adamiecki's earlier work dates to 1896. The four parts below are what you need to read or build one.
- Task bars. Each task gets a horizontal bar. Its position shows the start date and its length shows the duration.
- Dependencies. A dependency links two tasks so that one constrains the other. There are four types: finish-to-start (FS), start-to-start (SS), finish-to-finish (FF) and start-to-finish (SF).
- Milestones. A milestone is a zero-duration checkpoint, such as a client sign-off. PMI-style guidance names a milestone with the deliverable plus a state word such as "ready", "complete" or "sign-off", so approvals stand apart from ongoing work.
- Critical path and float. Float, also called slack, is the number of days a task can slip before it delays the next task or the final deadline. A critical path flag marks the tasks with no room left.
Timing matters more as work gets harder. PMI's Pulse of the Profession report from May 2026 found that 97% of professionals had managed at least one complex project in the past year. The same report puts failure at roughly one-third of complex projects, against 13% of projects overall.
Next, here is what the free options actually give you.
How can you get a Gantt chart free?
You can get a Gantt chart free from browser makers, open-source tools, spreadsheets, or the free tiers of project apps. The catch differs by path: saving limits, export gates, usage caps or a card-required trial. The table below shows what each option gives you and where it stops, checked November 13, 2026.
| Option | What you get for free | The catch |
|---|---|---|
| OnlineGantt | Browser app, no signup or download; Excel import; export to Excel, PDF and 1x to 3x images | Autosave is off locally, cloud storage is a 7-day trial, and domain embeds need Pro |
| Repsona Gantt-san | Free in the browser with no login; save and reload as a local file; share links with an optional password; print and XLSX export | Anyone holding an unpassworded board URL can open and edit it |
| GanttChartMaker.com | Drag-and-drop scheduling, Excel import, reusable templates, PDF, PNG and Excel export, no signup | The site lists no paid tiers or task limits, so check its current terms before relying on it for large plans |
| TeamGantt AI generator | A plain-language prompt or pasted task breakdown becomes phases, tasks and milestones in a free CSV, no account | Editing live in the browser leads into a 14-day trial that needs a credit card |
| Canva | Visual and whiteboard Gantt templates, exportable to PDF or PNG or shared by view-only link | Edits are manual with no dependency cascade; premium elements are watermarked on Free; transparent PNG, WebP and SVG need a paid plan |
| GanttProject | Free open-source desktop app (GPL-3.0) for Windows, macOS and Linux, with no task limits | No phone or tablet app, and tasks are measured in days or weeks, not hours |
| OpenProject Community | Self-hosted, free (GPL v3), with dynamic Gantt charts, dependencies and milestones for unlimited users and projects | PDF Gantt export needs a paid Enterprise edition |
| Mermaid | Gantt charts rendered from text definitions, free | You edit plain text by hand |
| Microsoft Excel | Free online templates, or a stacked-bar chart you build yourself | Excel has no native Gantt chart type |
| Google Sheets | Stacked-bar chart on any account | Insert > Timeline needs an eligible paid Workspace plan |
Which free online Gantt makers need no signup?
OnlineGantt, Repsona Gantt-san and GanttChartMaker.com all work without registration, and TeamGantt's AI generator gives you a CSV without an account. They suit a quick schedule you will share once. They are weaker for a plan you will edit for months.
OnlineGantt's missing local autosave means you should export your work before closing the tab. Repsona Gantt-san saves and reloads as a local file, and it can also connect to Claude or ChatGPT through MCP. Add a password to any Repsona share link, since an open board URL can be edited by whoever holds it. TeamGantt's generator is useful for a first draft of phases and milestones, but continuing in its live editor starts a card-required trial.
What are the best open-source and offline Gantt tools?
GanttProject, OpenProject Community and Mermaid have no task or project ceilings. GanttProject is the simplest to start with, because it is a desktop app with no signup. OpenProject needs you to host it, and Mermaid suits people who are comfortable writing text.
GanttProject has been active since 2003, and its version 3.3 stable release was updated on November 7, 2026. It includes a task hierarchy, automatically scheduled dependencies, milestones, baselines, resource load charts, task costing from rates and read-only PERT diagrams. It opens MS Project formats (MPX, MPP, MSPDI) and exports to PDF, HTML, PNG and CSV. If a wide PNG export looks blurry, export a scalable PDF instead, or narrow the range in the export wizard. Real-time co-editing needs the optional GanttProject Cloud.
Mermaid draws Gantt charts from short text definitions. It supports section groups, tasks that start after another task, weekend and date exclusions, critical-task highlighting, milestones and vertical markers. That fits technical documentation well, but it is slow to edit when dates move often.
How do you make a Gantt chart free in Excel or Google Sheets?
Both spreadsheets can draw a Gantt chart for free by turning a stacked bar chart into a timeline. You build a table of tasks, start dates and durations, hide the start series, and flip the task order. Google Sheets adds a native Timeline option, but it is not available to everyone.
Many spreadsheet tutorials tell you to click Insert > Timeline in Google Sheets without mentioning a licensing barrier. Google's Help Center limits creating a Timeline to eligible paid Workspace editions, including Essentials, Business Standard and Business Plus. Personal Google accounts only gained mobile viewing of timelines in November 2023, and a Business Starter trial user reported the option missing. Free personal accounts should use the stacked-bar method.
To build it in Google Sheets:
- Put task names in column A, start dates in column B and end dates in column C, all stored as real dates.
- In column D, add a "Start on Day" offset: each task's start date minus the project's first start date, for example
=INT(B2)-INT($B$2). - In column E, add an inclusive duration with
=C2-B2+1. - Select the task names, Start on Day and Duration columns, and insert a Standard Stacked Bar chart.
- Set the fill opacity of the Start on Day series to 0% so only the duration bars show.
- Set the horizontal gridlines major step to 7 for weekly lines, or 30 as a rough monthly guide.
In Excel, build the same table with Task, Start Date and Duration columns. Use Insert > Recommended Charts > Stacked Bar, set the Start series to Shape Fill > No Fill, and tick "Categories in reverse order" on the vertical axis so the first task sits at the top. You can also start from Microsoft's free online Simple or Agile Excel templates.
Spreadsheet Gantt charts have one weakness. Dates do not shift downstream tasks on their own unless you wire up fragile =MAX(...) and =MIN(...) dependency formulas by hand. Day-number axes may also need formatting changes before they display calendar dates cleanly.
What do popular project tools really include on free plans?
Several well-known project tools either leave the Gantt view out of their free plan or limit it tightly. The table below lists the limits found for each as of November 13, 2026. Prices are left out because the figures found for paid plans came from a third-party comparison, not from each vendor.
| Tool and plan | Gantt or timeline on the free plan |
|---|---|
| Asana Personal | No Timeline or Gantt view. It connects to a third-party app, Instagantt, whose standalone free limits could not be confirmed |
| monday.com Free | No Timeline or Gantt view. The plan has 2 seats, 3 boards and 500 MB of storage |
| Wrike Free | Gantt is not included on the free plan |
| ClickUp Free Forever | Gantt view capped at 60 uses and Timeline view at 60 uses; custom task types, including Milestones, capped at 20 uses; baselines and PDF or PNG Gantt export need Business or above |
| TeamGantt Personal ($0) | Dependencies and drag-and-drop for 1 user, 1 project and 40 tasks, unlocked only after a 14-day trial that requires a credit card |
| Notion Free | Timeline view with unlimited blocks for a single owner; a second workspace owner brings a permanent 1,000-block cap and 7-day version history; dependencies need manual Relation and Rollup setup |
| Smartsheet, GanttPRO | No free-forever web plan; 30-day and 14-day trials |
ClickUp's own documentation describes Critical Path inside Gantt view without confirming extra plan gating beyond the 60-use cap, while a 2026 vendor blog says Critical Path is included on the free plan. Treat that as unresolved and check ClickUp's pricing page. Roundups also get these tiers wrong: one 2026 blog claims Wrike Free includes Gantt charts, which contradicts Wrike's own documentation.
A disclosure: Prolanze makes a project workspace with a project-level Gantt view and project templates, so it is a candidate in this comparison. It is an account-based tool, not a no-signup widget or an offline file. Prolanze also lets you switch the same project to a Kanban board or task list when a Gantt chart is overkill. New accounts get a 30-day Pro trial with no card required, and the pricing page shows what the Free plan includes. If you want a full comparison of workspaces beyond the schedule view, see our roundup of free project management tools.
What are the steps to build a Gantt chart in any free tool?
Every free tool needs the same five steps: fix the scope and deadline, list outcome-based tasks, estimate durations from real capacity, link tasks and milestones, and save a baseline. The order matters, because dates come last. This sequence follows PMI-based planning guidance as summarized in the sources we reviewed.
- Lock the frame. Set the scope, the working-day calendar (weekends and holidays) and the final deadline. State whether "due" means handed to the client or live to the public.
- Break the work into outcome-based tasks. Write tasks as results ("Create homepage wireframes", not "Work on design"). PMI's 1% to 10% rule says no detail task should exceed 10% of the project length or one reporting period.
- Estimate from real capacity. PMI defines Duration = Work / Availability. Give each task one owner, then enter start and end dates.
- Link tasks and milestones. Anchor your chain between a Project Start milestone and a Project Complete milestone. Link detail tasks only, never summary rows.
- Save a baseline, then update. Keep a copy of the signed-off plan before work starts, and update the chart as decisions happen.
Now for the layout that holds those steps together.
Template for a Gantt chart: the layout to copy
A template for a Gantt chart is a pre-arranged table of columns and a calendar grid that you fill in for each project. This section gives you the column order and the reason for each column, so you can recreate it in any tool above. If you would rather start from a finished file, download the free template after the table.
Start with a header block above the table. Include the project title, the client or studio name, today's date or version, a legend, and a top summary task that rolls up the total dates. Add the calendar rules (working days versus calendar days, plus holidays) and one line defining the final deadline. That block prevents the off-by-a-weekend mistakes that appear at kickoff.
Then build the columns in this left-to-right order:
| Column | What it holds and why it matters |
|---|---|
| Outline number and phase row | Numbers such as 1, 1.1 and 1.2 group tasks into stages, so progress rolls up cleanly for clients |
| Task ID | A short number that predecessor formulas and arrows can reference without long titles |
| Task name | A concrete deliverable with a clear finish condition, so progress can be checked |
| Task type or milestone flag | Separates multi-day work from zero-duration checkpoints, and requires start and complete milestones |
| Owner | One accountable person per detail task; keep client-owned approval tasks separate from your own deliverables |
| Start date and end date | Real date values, never text, so scaling and sorting work |
| Duration (plus Start on Day for stacked bars) | Inclusive days, calculated as end minus start plus one |
| Predecessors | The linked task ID, the dependency type (FS, SS, FF or SF) and any lag, on detail tasks and milestones only |
| Status and percent complete | Drives progress fill or at-risk colors during client reviews |
| Baseline start, baseline finish and variance | The original plan next to current dates, so slippage is measurable |
| Float and critical path flag | Shows how many days a task can slip before it delays the next task or the deadline |
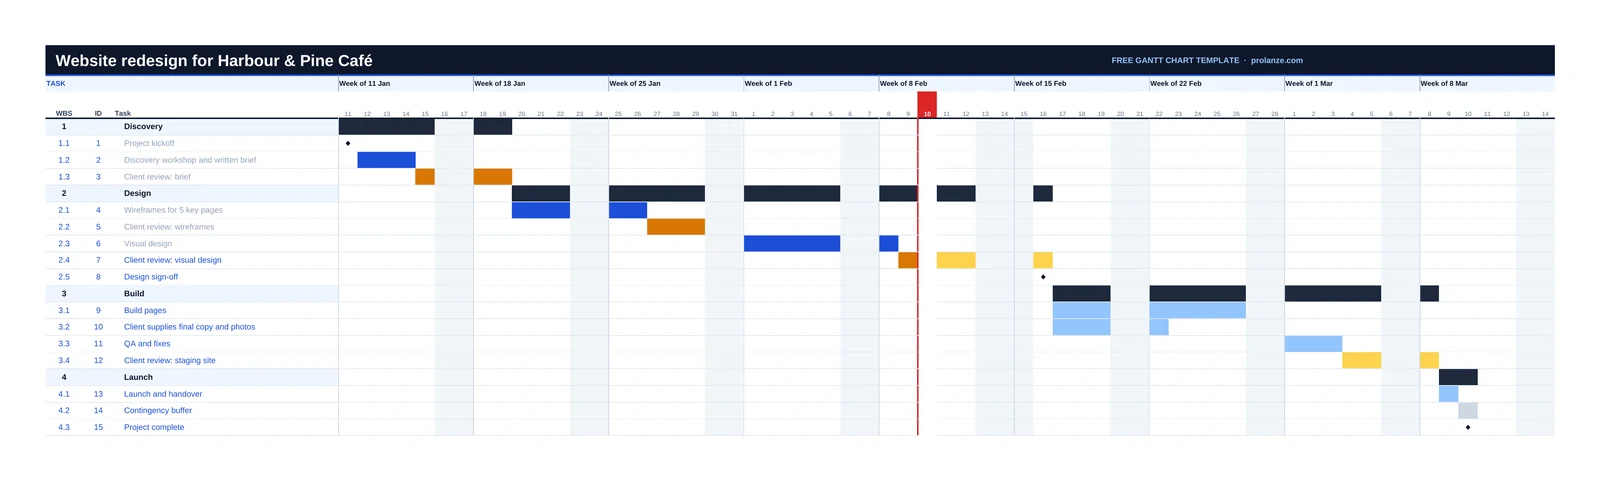
Free download · XLSX · 44 KB
Every column above, ready to fill in. Change a duration and every later date moves, client reviews show in amber, and a Client view tab rolls the plan up to phases and sign-offs.
Excel, Google Sheets or LibreOffice. No sign-up.
What do free Gantt templates leave out?
Free Gantt templates usually leave out five controls that freelancers depend on: client review deadlines, a locked baseline, working-day and availability settings, boundary milestones, and a contingency buffer. Adding each one takes only a few extra rows or columns, and each one protects a date you have promised a client.
- Client approval gates. Give each client review a written due date and mark it as a client-owned task. Freelancers on Webflow and agency forums report clients stalling feedback by up to a month, which wrecks the next booked project.
- A locked baseline. Keep Plan versus Actual columns so you can show where and why dates moved.
- Working-day and availability rules. A worked example from PMI's formula: 60 hours of hands-on work at 50% availability on this project becomes 120 work-hours, which is 15 working days at 8 hours a day, not 7.5. Shared load across clients and weekends make schedules slip if you ignore them.
- Start and Complete milestones. These stop any task from becoming a dangling "hanger" with nothing linked to it.
- A contingency buffer. PMI guidance recommends an explicit contingency task at the end of the chain, so small delays shrink the buffer instead of forcing a full rewrite. Solo developers commonly add about 30% padding, which is a practitioner habit rather than a standard.
How do you turn the template into a client-ready schedule?
Show clients a short, rolled-up view and keep the detail in your own sheet. Roll tasks up into a handful of phase bars, show ranged dates while scope is still forming, and tie each approval to a milestone the client can see.
- Quote ranged durations early. PMI's Disciplined Agile guidance favors broad phase windows over single-day dates that imply false precision, for example Discovery in 2 to 3 weeks and Design in 5 to 8 weeks, tied to how quickly the client responds.
- Keep two zoom levels across several clients. Hold granular subtasks in each client's own sheet, and roll up a studio-wide timeline with about 5 to 7 bars per project to spot stacked deadlines and shared bottlenecks. The 5-to-7-bar figure is a low-confidence practitioner rule, not a standard.
- Use a rolling horizon for uncertain work. Draw task-level bars only for the next 4 weeks and keep later months as broad phase blocks that you update weekly.
A worked delay example comes from Productive's agency workback guide. Its schedule puts the deadline at the top with an exact hour, such as Friday at 5:00 pm, and gets written sign-off from the client's approver. When a client returned design feedback 3 working days late, two built-in buffers absorbed 2 days, and the third day cut into QA. The studio then gave the client two written options that traded scope against dates.
Some freelancers pair milestones with staged payments to keep client review speed in step with the schedule. One agency practitioner's example is 50% upfront, 25% at concept sign-off and 25% on completion. This is general workflow information, not legal or financial advice. Written delay and change-order terms are what make review gates hold, so see these freelance contract clauses. For turning a signed-off milestone into a payment request, use a clean freelance invoice template. Once your chart shows real durations and buffers, how to price freelance work explains how to carry them into a quote.
Once you have a layout, the next question is when not to use it.
When should you skip a Gantt chart?
Skip a Gantt chart when dates are not fixed or tasks change faster than you can update the bars. Short to-do lists, open-ended retainers, daily-shifting priorities, early discovery work, dense dependency webs and executive summaries each have a better fit, as the table below shows.
| Situation | Why Gantt struggles | What to use instead |
|---|---|---|
| Quick-turn or daily tasks | TeamGantt and GanttProject both note that checklists and schedules measured in hours or minutes beat the overhead of bars | A task list or checklist |
| Open-ended retainers with no deadlines | With no fixed end dates or checkpoints, bars add clutter without scheduling value | A task list; add milestones only if dates appear |
| Priorities that shift daily | Asana, Notion and Bitrix24 guides recommend status boards over timelines when work moves through stages, not dates | A free Kanban board |
| Early discovery and undefined scope | Gantt assumes you know the tasks and their order, so exact bars create false precision | Notes or a whiteboard first, then a 4-week rolling Gantt |
| Dense, non-linear dependency webs | Microsoft, Asana and NASA note that PERT network diagrams handle dependency mapping and duration estimates better | A PERT network diagram, or a phase-by-workstream grid |
| Executive updates and budget forensics | PMI's Disciplined Agile guidance warns against task-level detail on Agile or Lean Gantt charts; practitioners add that busy charts get ignored and cannot replace Earned Value | High-level milestones with ranged dates |
For the daily-shift case, the simplest move is to stop dating the work and manage stages visually, which our guide to define Kanban explains.
Putting it into practice
Use this checklist before you share any free Gantt chart with a client.
- Confirm the tool's free limits (uses, projects, exports, sharing) on its pricing page today.
- Set the final deadline and say whether "due" means delivered or live.
- Mark working days and holidays in the calendar block.
- Write every task as a result, and keep detail tasks within PMI's 1% to 10% sizing rule.
- Add a Project Start and a Project Complete milestone.
- Add a client review row with a written due date after each deliverable.
- Size durations with Work / Availability, not effort alone.
- Add a contingency row at the end of the chain.
- Save a baseline copy before work begins.
- Show the client a rolled-up view with ranged dates where scope is still open.
Conclusion
The best way to get a Gantt chart free is to match the tool to the job. Use a no-signup browser maker for a one-off view, GanttProject for a private plan with no caps, and a stacked-bar sheet for a small schedule. Check every plan's caps first. Add client review rows, a baseline and a buffer so the chart survives real client behavior, and skip Gantt when the work is too fluid for fixed dates.
If you would rather keep the schedule next to your tasks, time and invoices, you can start free with Prolanze and use the 30-day Pro trial, no card required, to see whether its Gantt view fits how you work.
Gantt charts and Prolanze
Prolanze's Schedule page includes a Gantt view that shows each of your projects as a bar from its start date to its due date, coloured on track, at risk or overdue. It is a project-level timeline, so for a detailed task-by-task schedule use the template above, and keep Prolanze for the part that touches money: time tracking, invoicing and what each client owes.